Open Discussions
This displays the number of unresolved discussion threads for the proposal. It shows a count of conversations that need attention or resolution from team members. Clicking on this card navigates to the discussions section where you can view and participate in ongoing conversations about the proposed changes.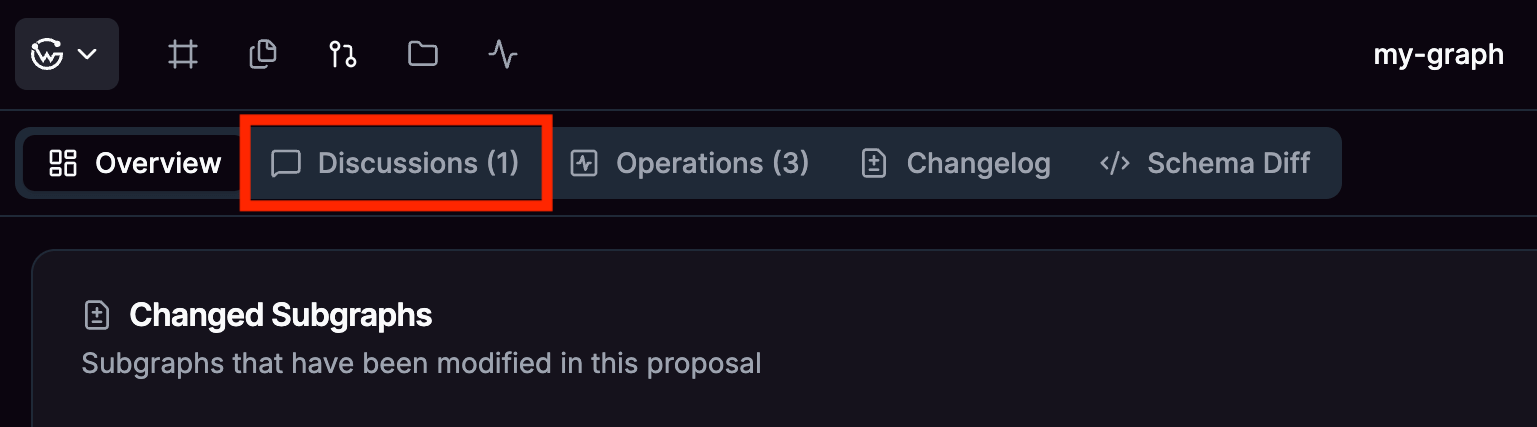
Operations Changed
This shows how many existing operations of the collections selected have been affected by the proposed changes. It provides a quick overview of the scope of impact on your existing operations. Clicking on this card takes you to a detailed view where you can examine each affected operation and understand the specific changes.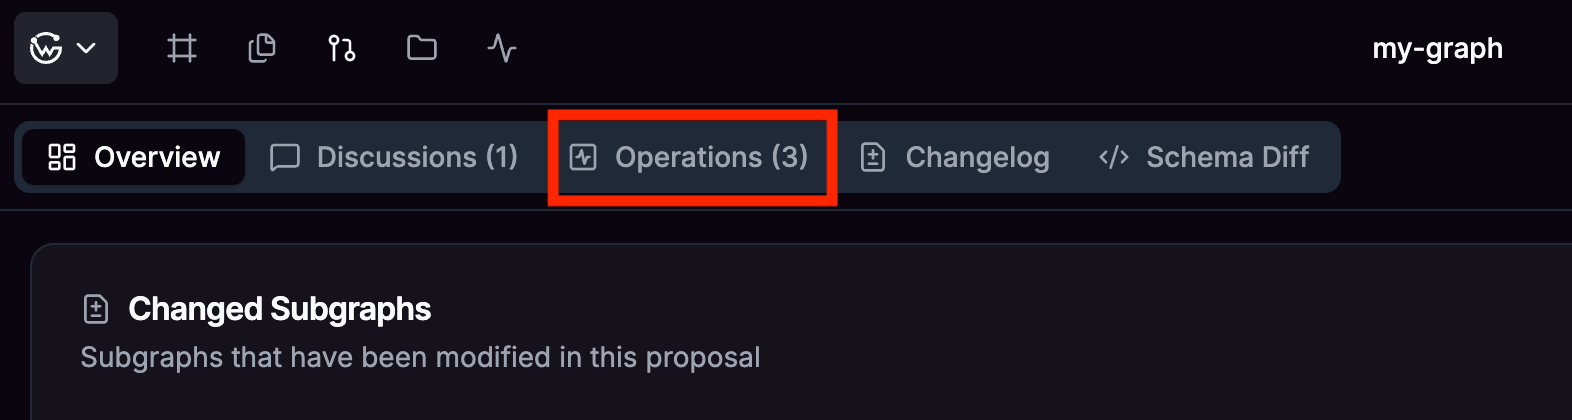
Changed Subgraphs
This shows the list of subgraphs have been modified, added, or removed in the proposal. It provides: Git Integration If the subgraph is connected to a GitHub repository or GitLab project, it will show the link to the associated pull request or merge request for each changed subgraph. Schema Access- Offers quick navigation to view the actual schema changes.
- Links to detailed diff views for review
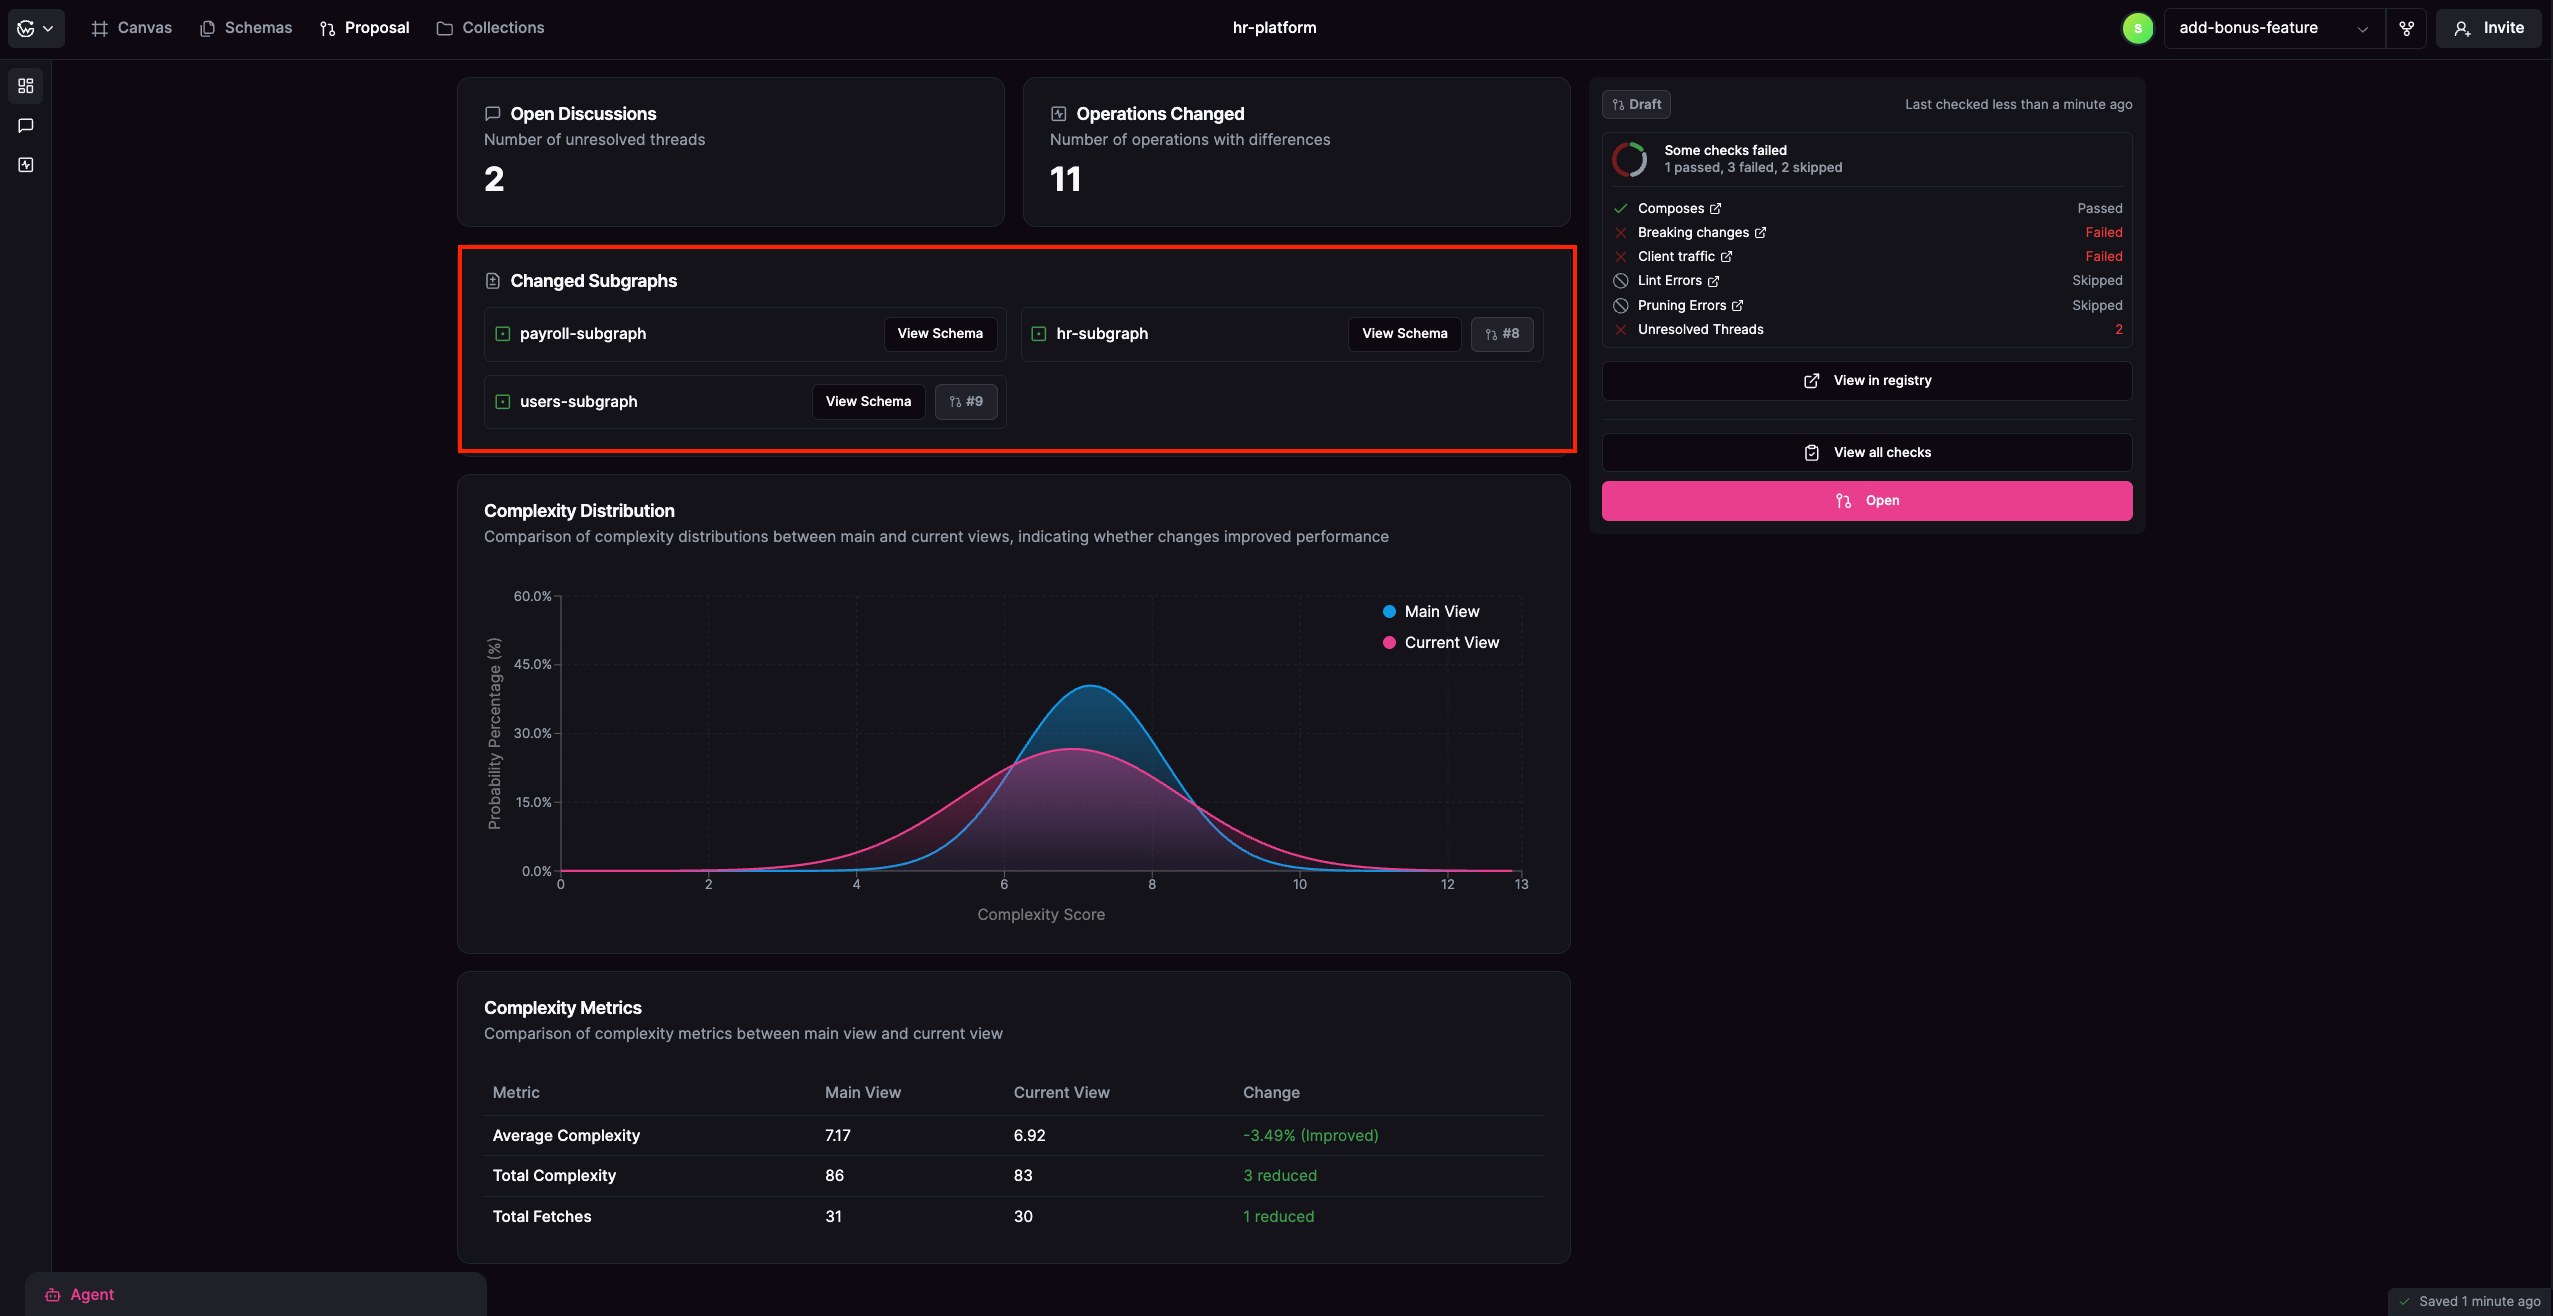
Complexity Distribution Chart
When collections are selected, this visual component displays a bell curve comparison showing how operation complexity is distributed between the current view and the main view. This helps identify whether the proposed changes improve or worsen the overall performance characteristics of your operations.Complexity Metrics table
This table provides detailed numerical comparisons between the main view and the proposed changes: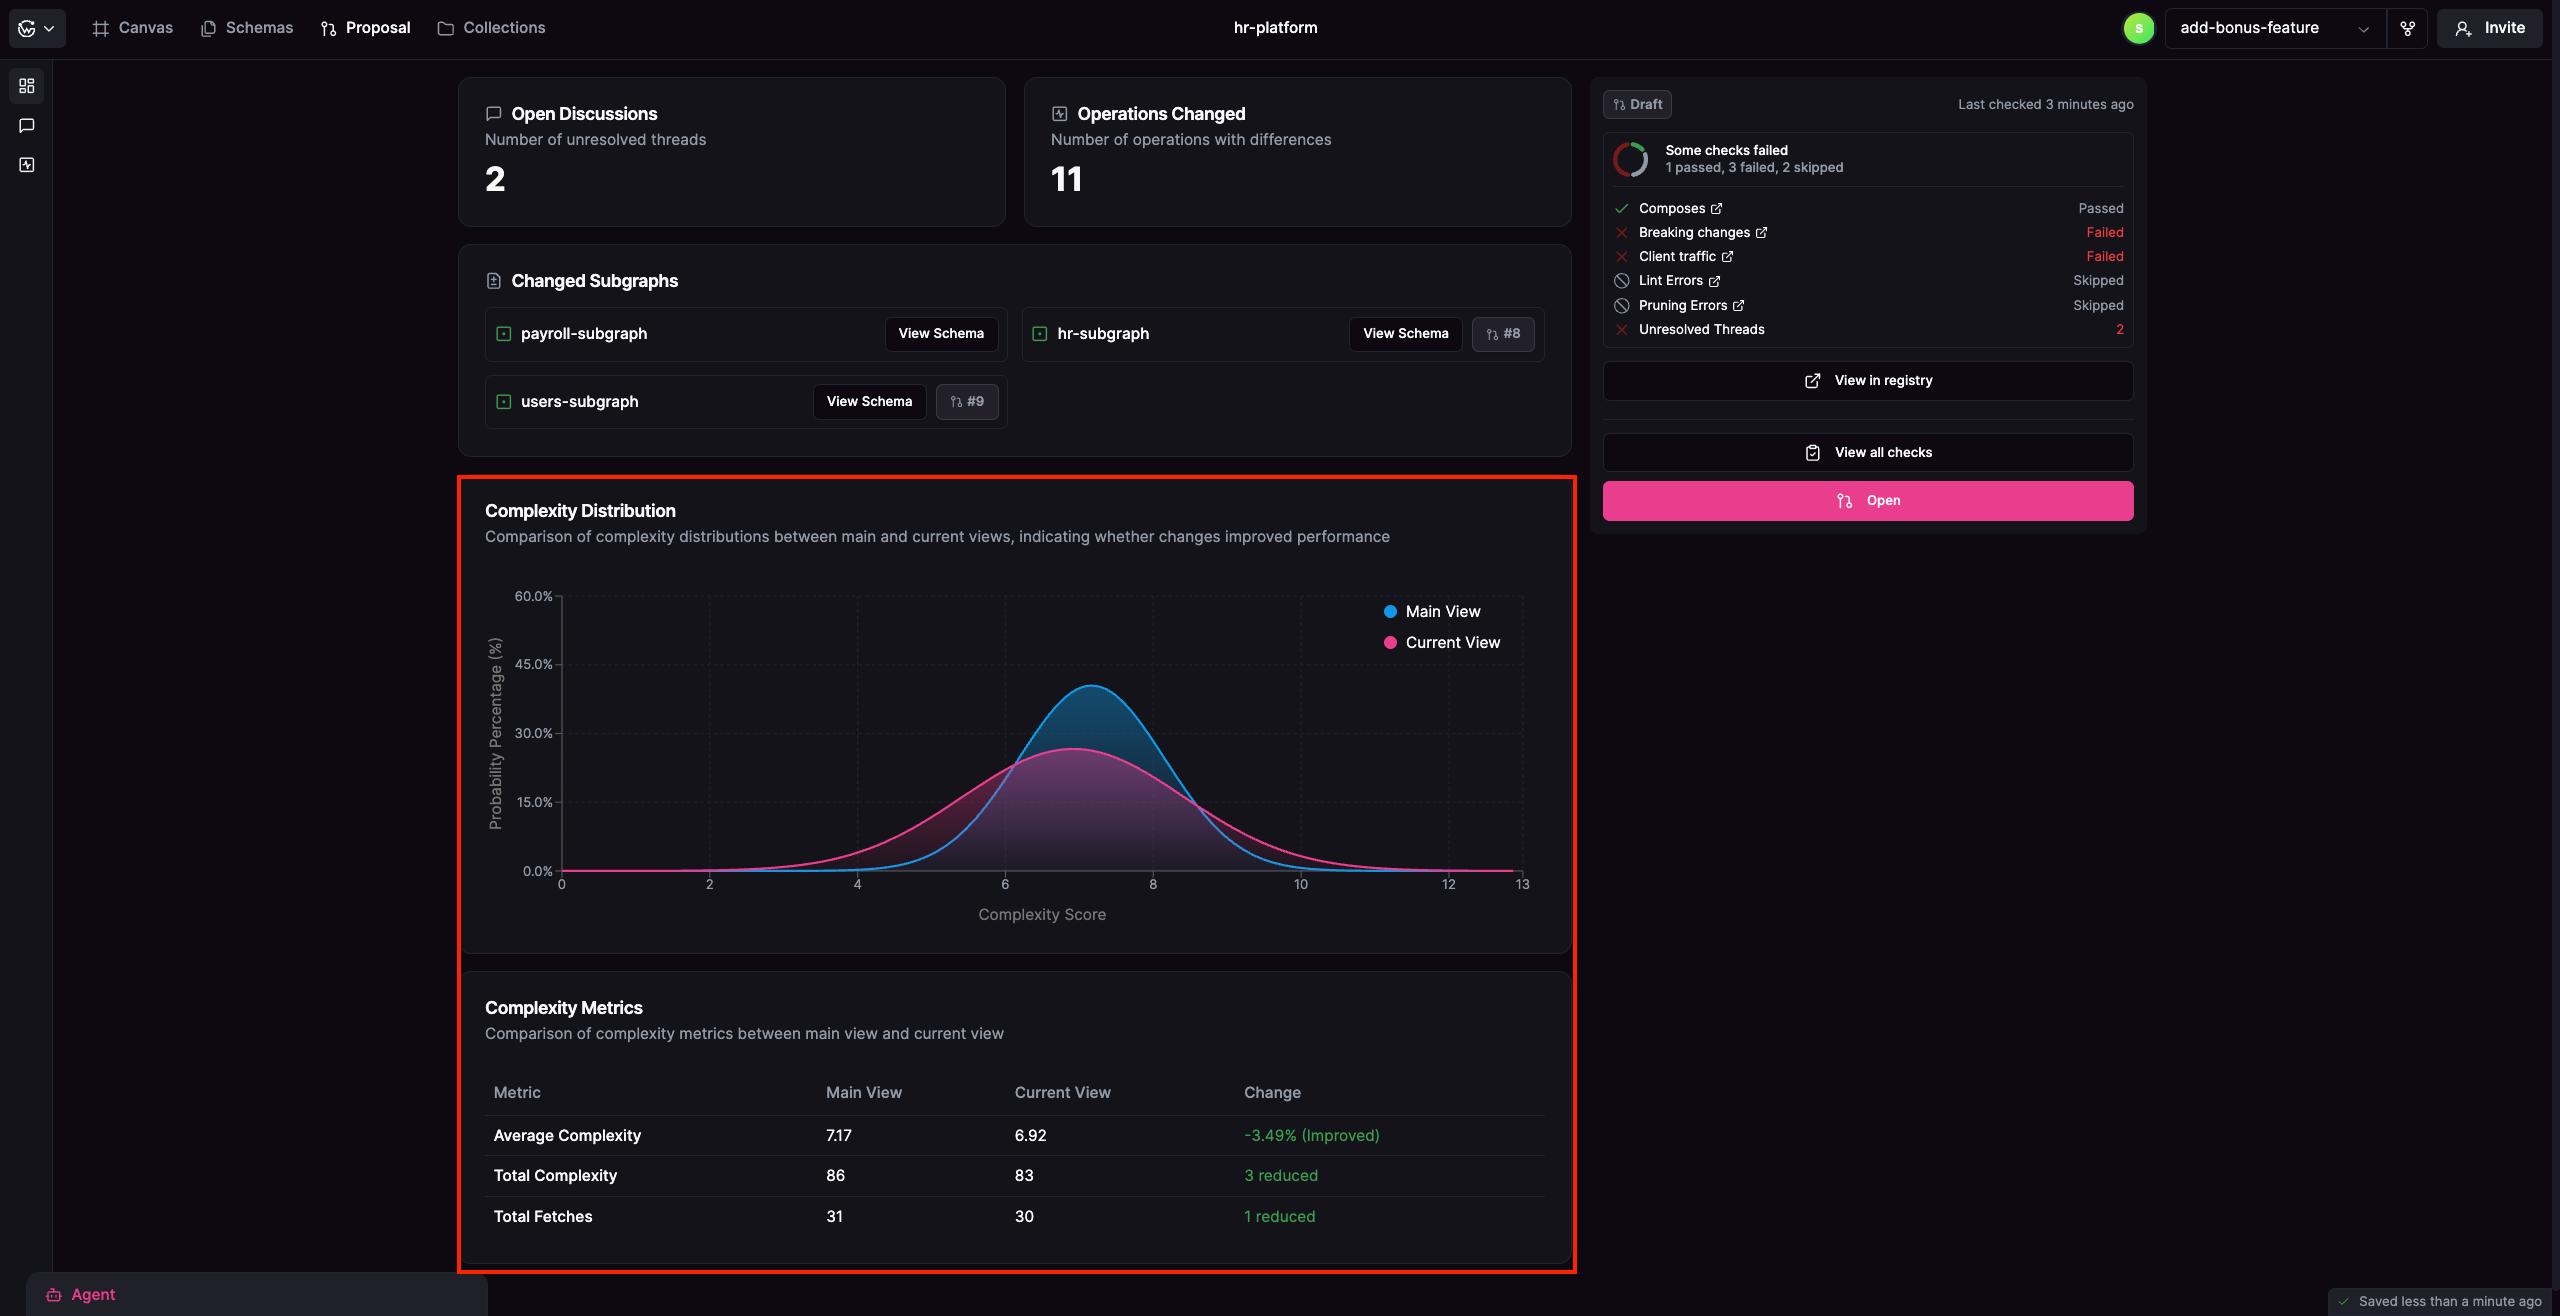
Proposal Summary
This section provides a summary of the proposal, includes the following:- Current state of the proposal
- Checks performed on the changed schema(s)
- Provides actions to view the proposal in the schema registry
- Provides actions to view all the checks performed on the proposal
- Provides actions to update the state of the proposal
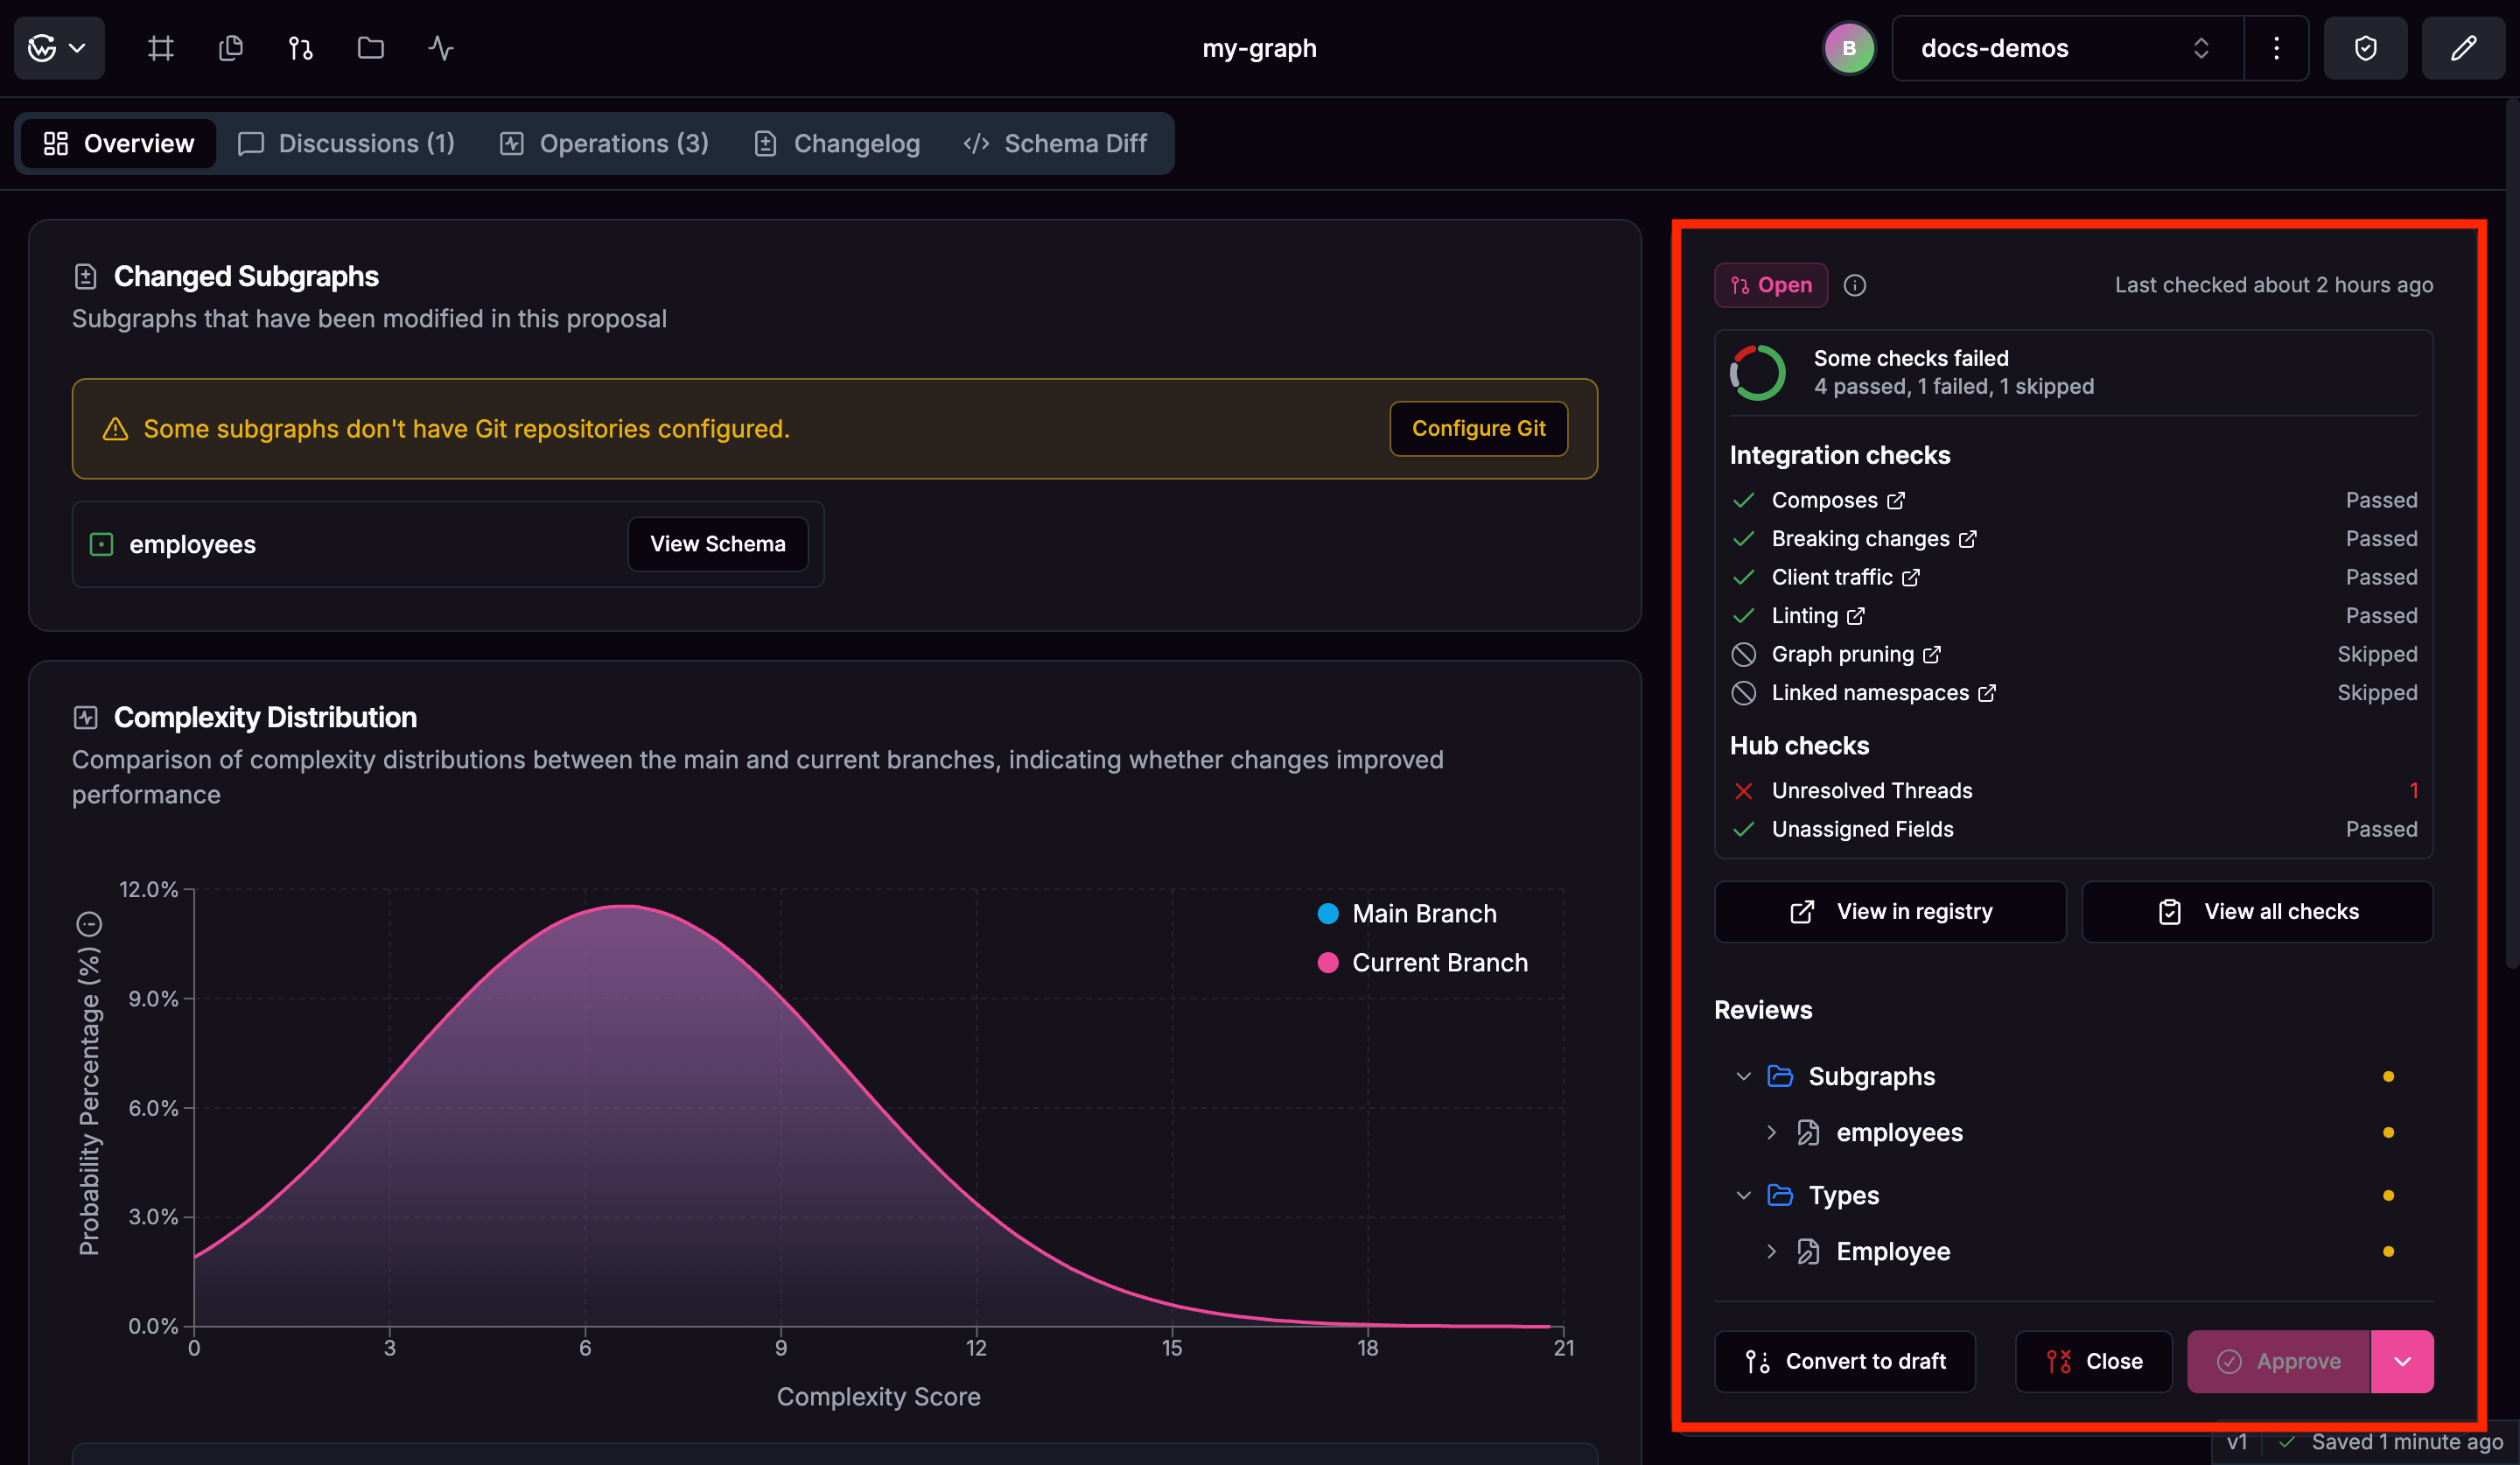
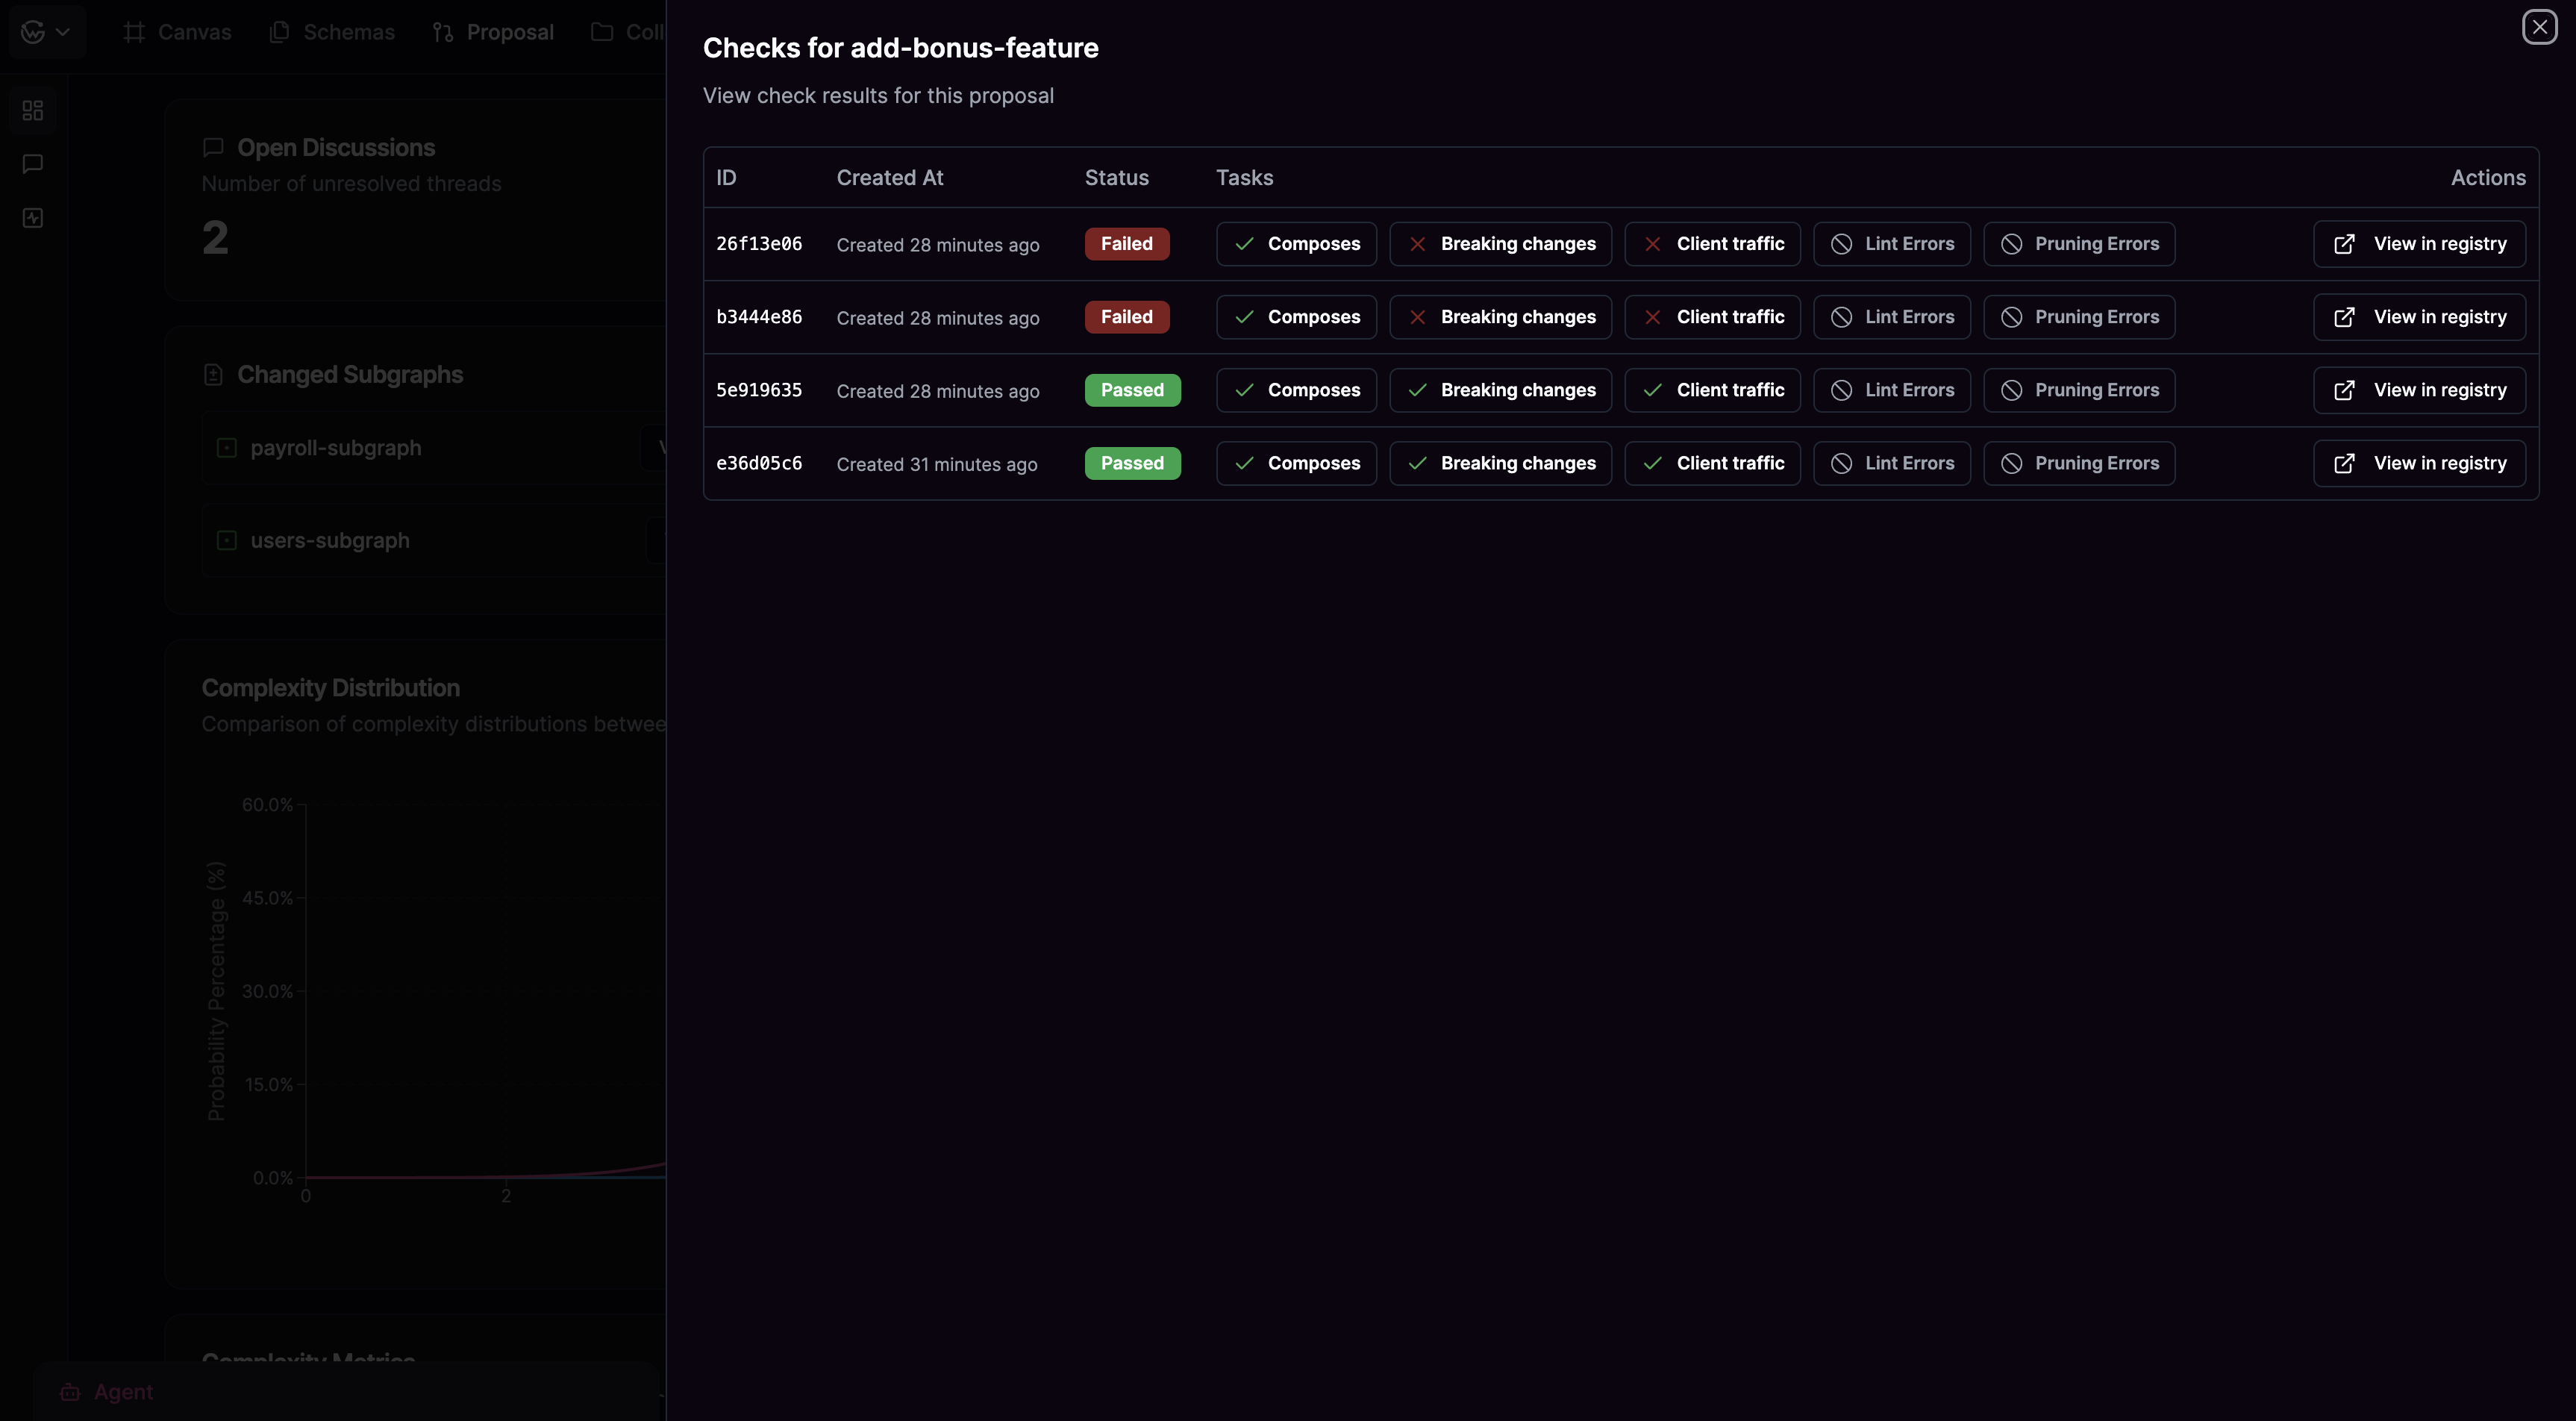
Proposal Checks
Once the proposal is created, on each change of the schema in the view a check is performed on WunderGraph Cosmo(Schema Registry) to ensure that the proposal is valid and safe to apply. To get more details about the checks performed on the proposal, click here.